Huntsville by Bike

Huntsville by Bike
Software: ArcGIS, Illustrator, MAPublisher, Photoshop, Blender
Client: David Nuttall
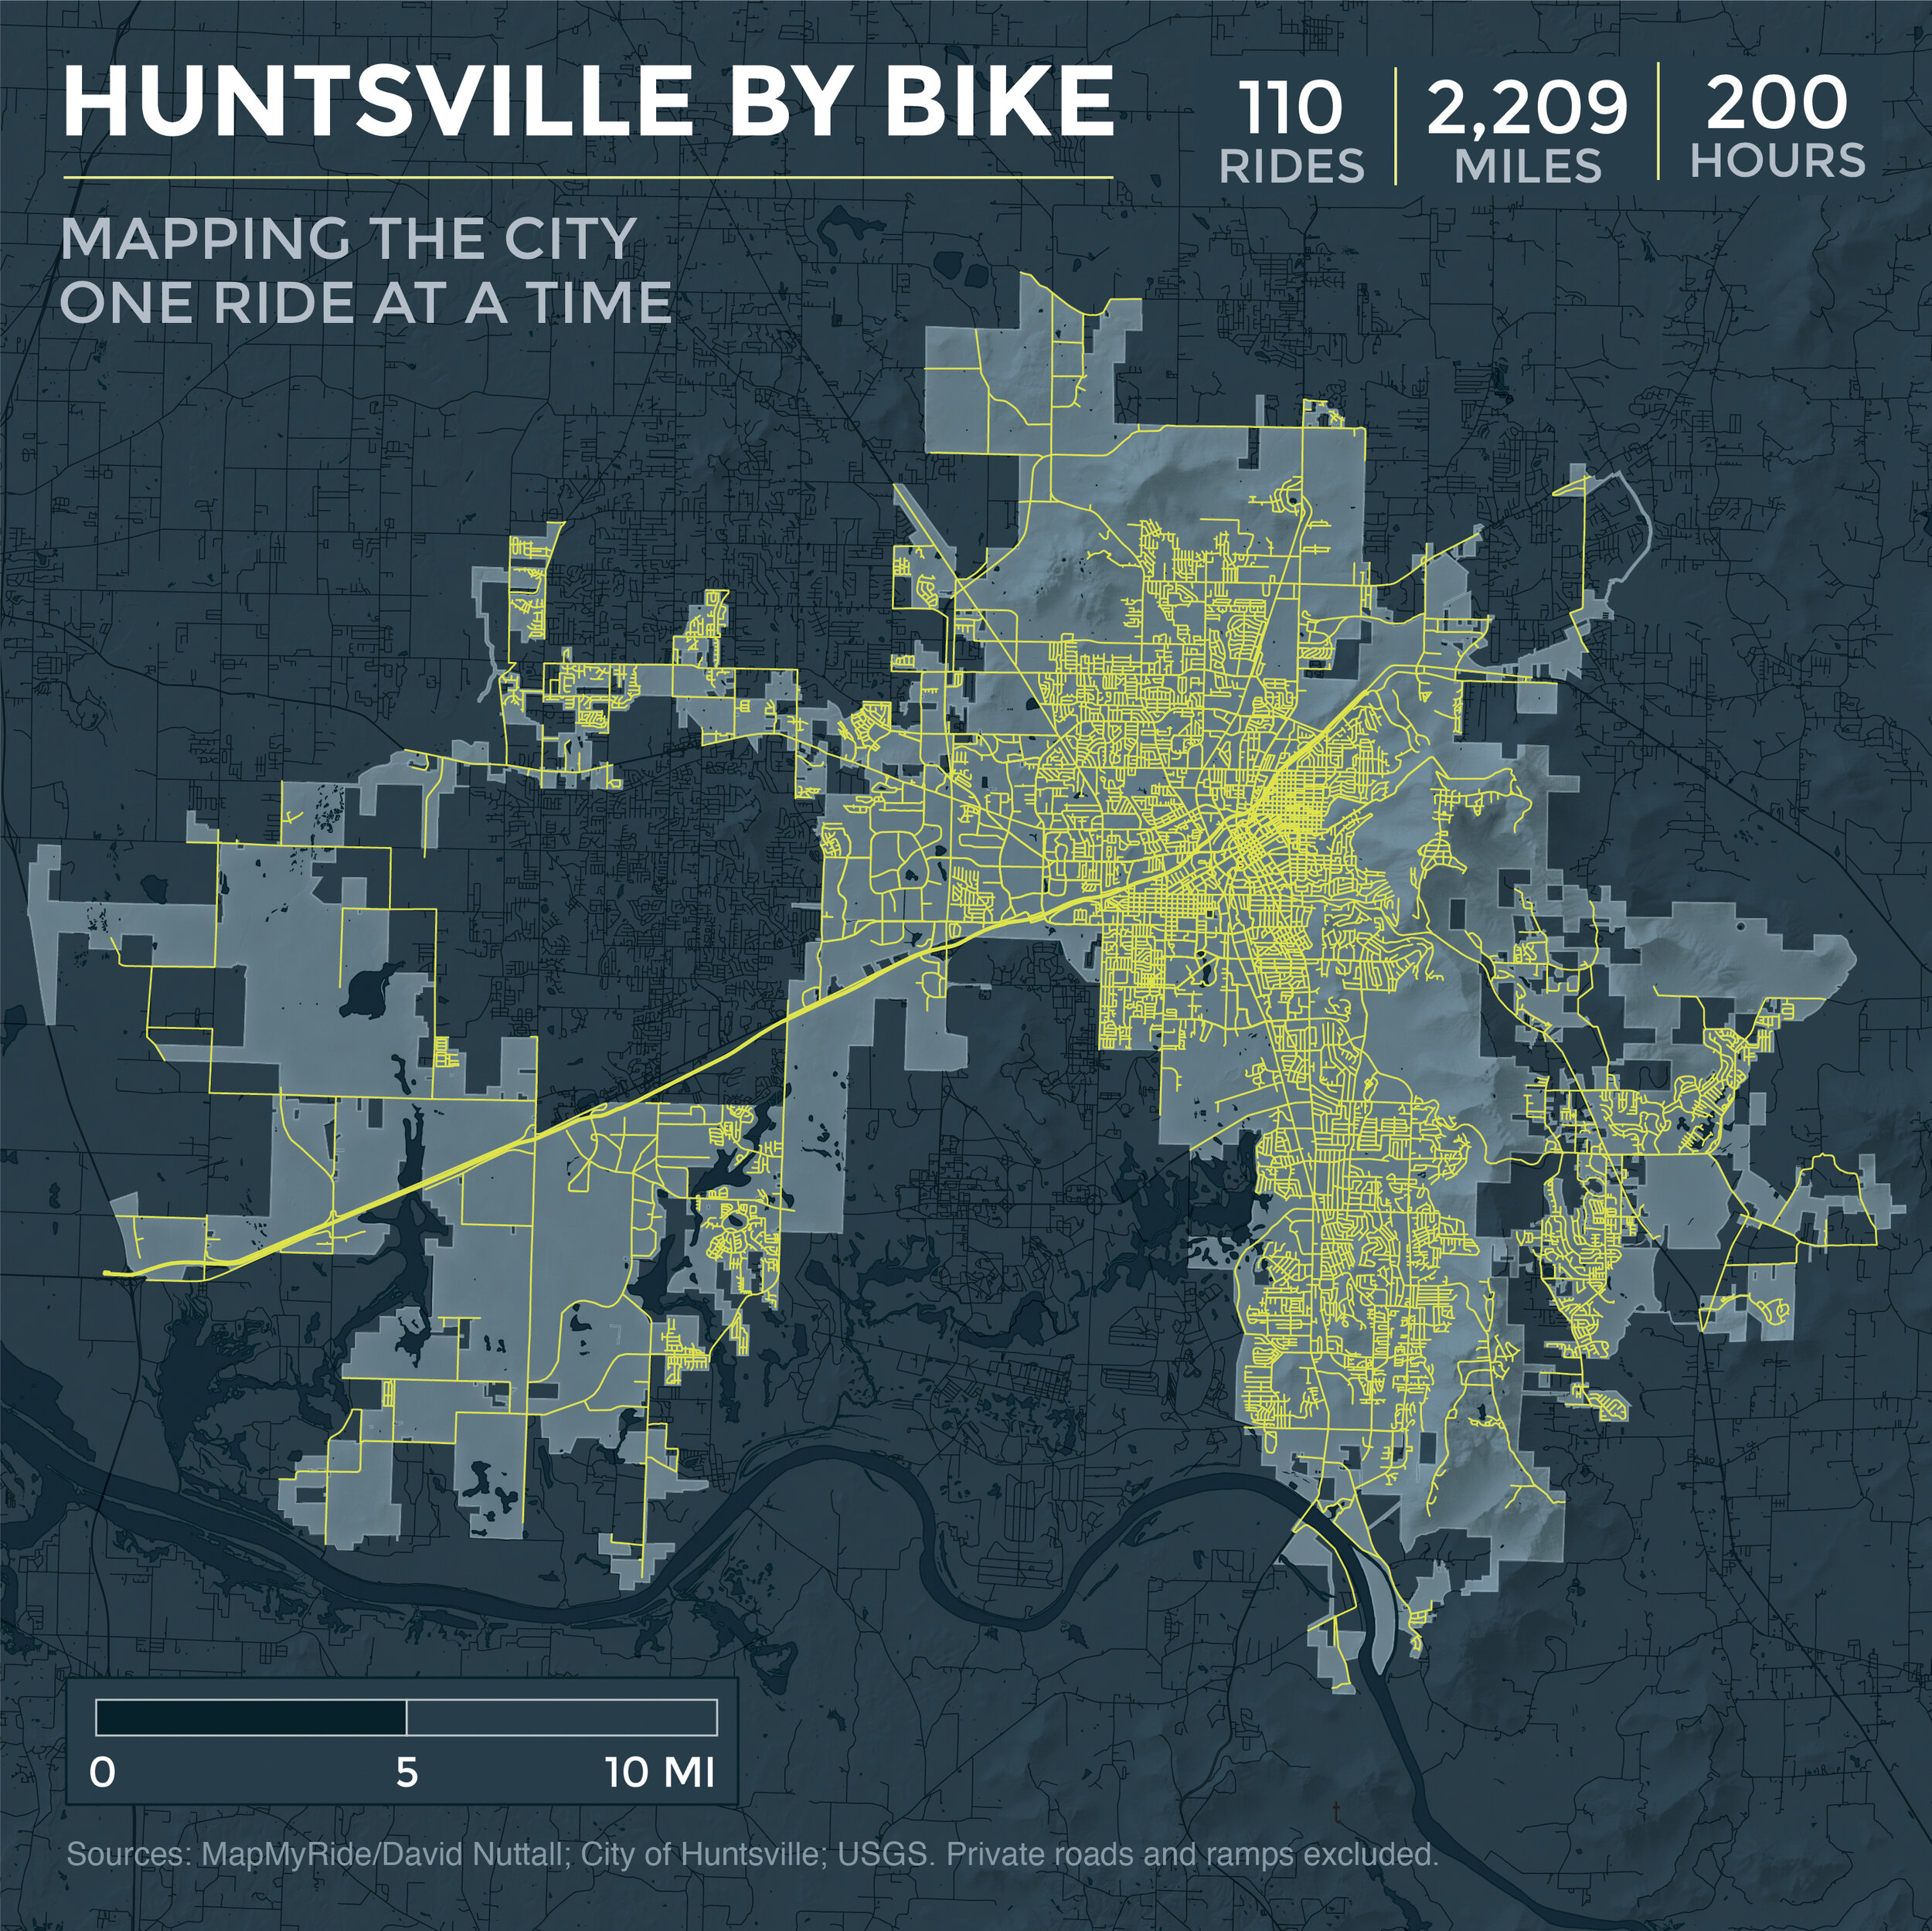
In 2019, David Nuttall, an Alabama-based artist and cartographer, began a quest to cycle every street within the city limits of Huntsville. Initially, I joked that someone should animate a map of his rides when he was done. Then I offered to animate it, but it wouldn’t be anything fancy. By the time I got the data, I decided I may as well go all the way and design something nice.
My first version of the map was a lighter, more traditional color scheme, but it wasn’t as attention-grabbing as it needed to be for social media. David’s cycling attire is a high-visibility Day-Glo yellow shirt, so I decided to play off that and developed a light-on-dark color scheme. I also chose to render the basemap in Blender to highlight the geographic diversity of the sprawling city.
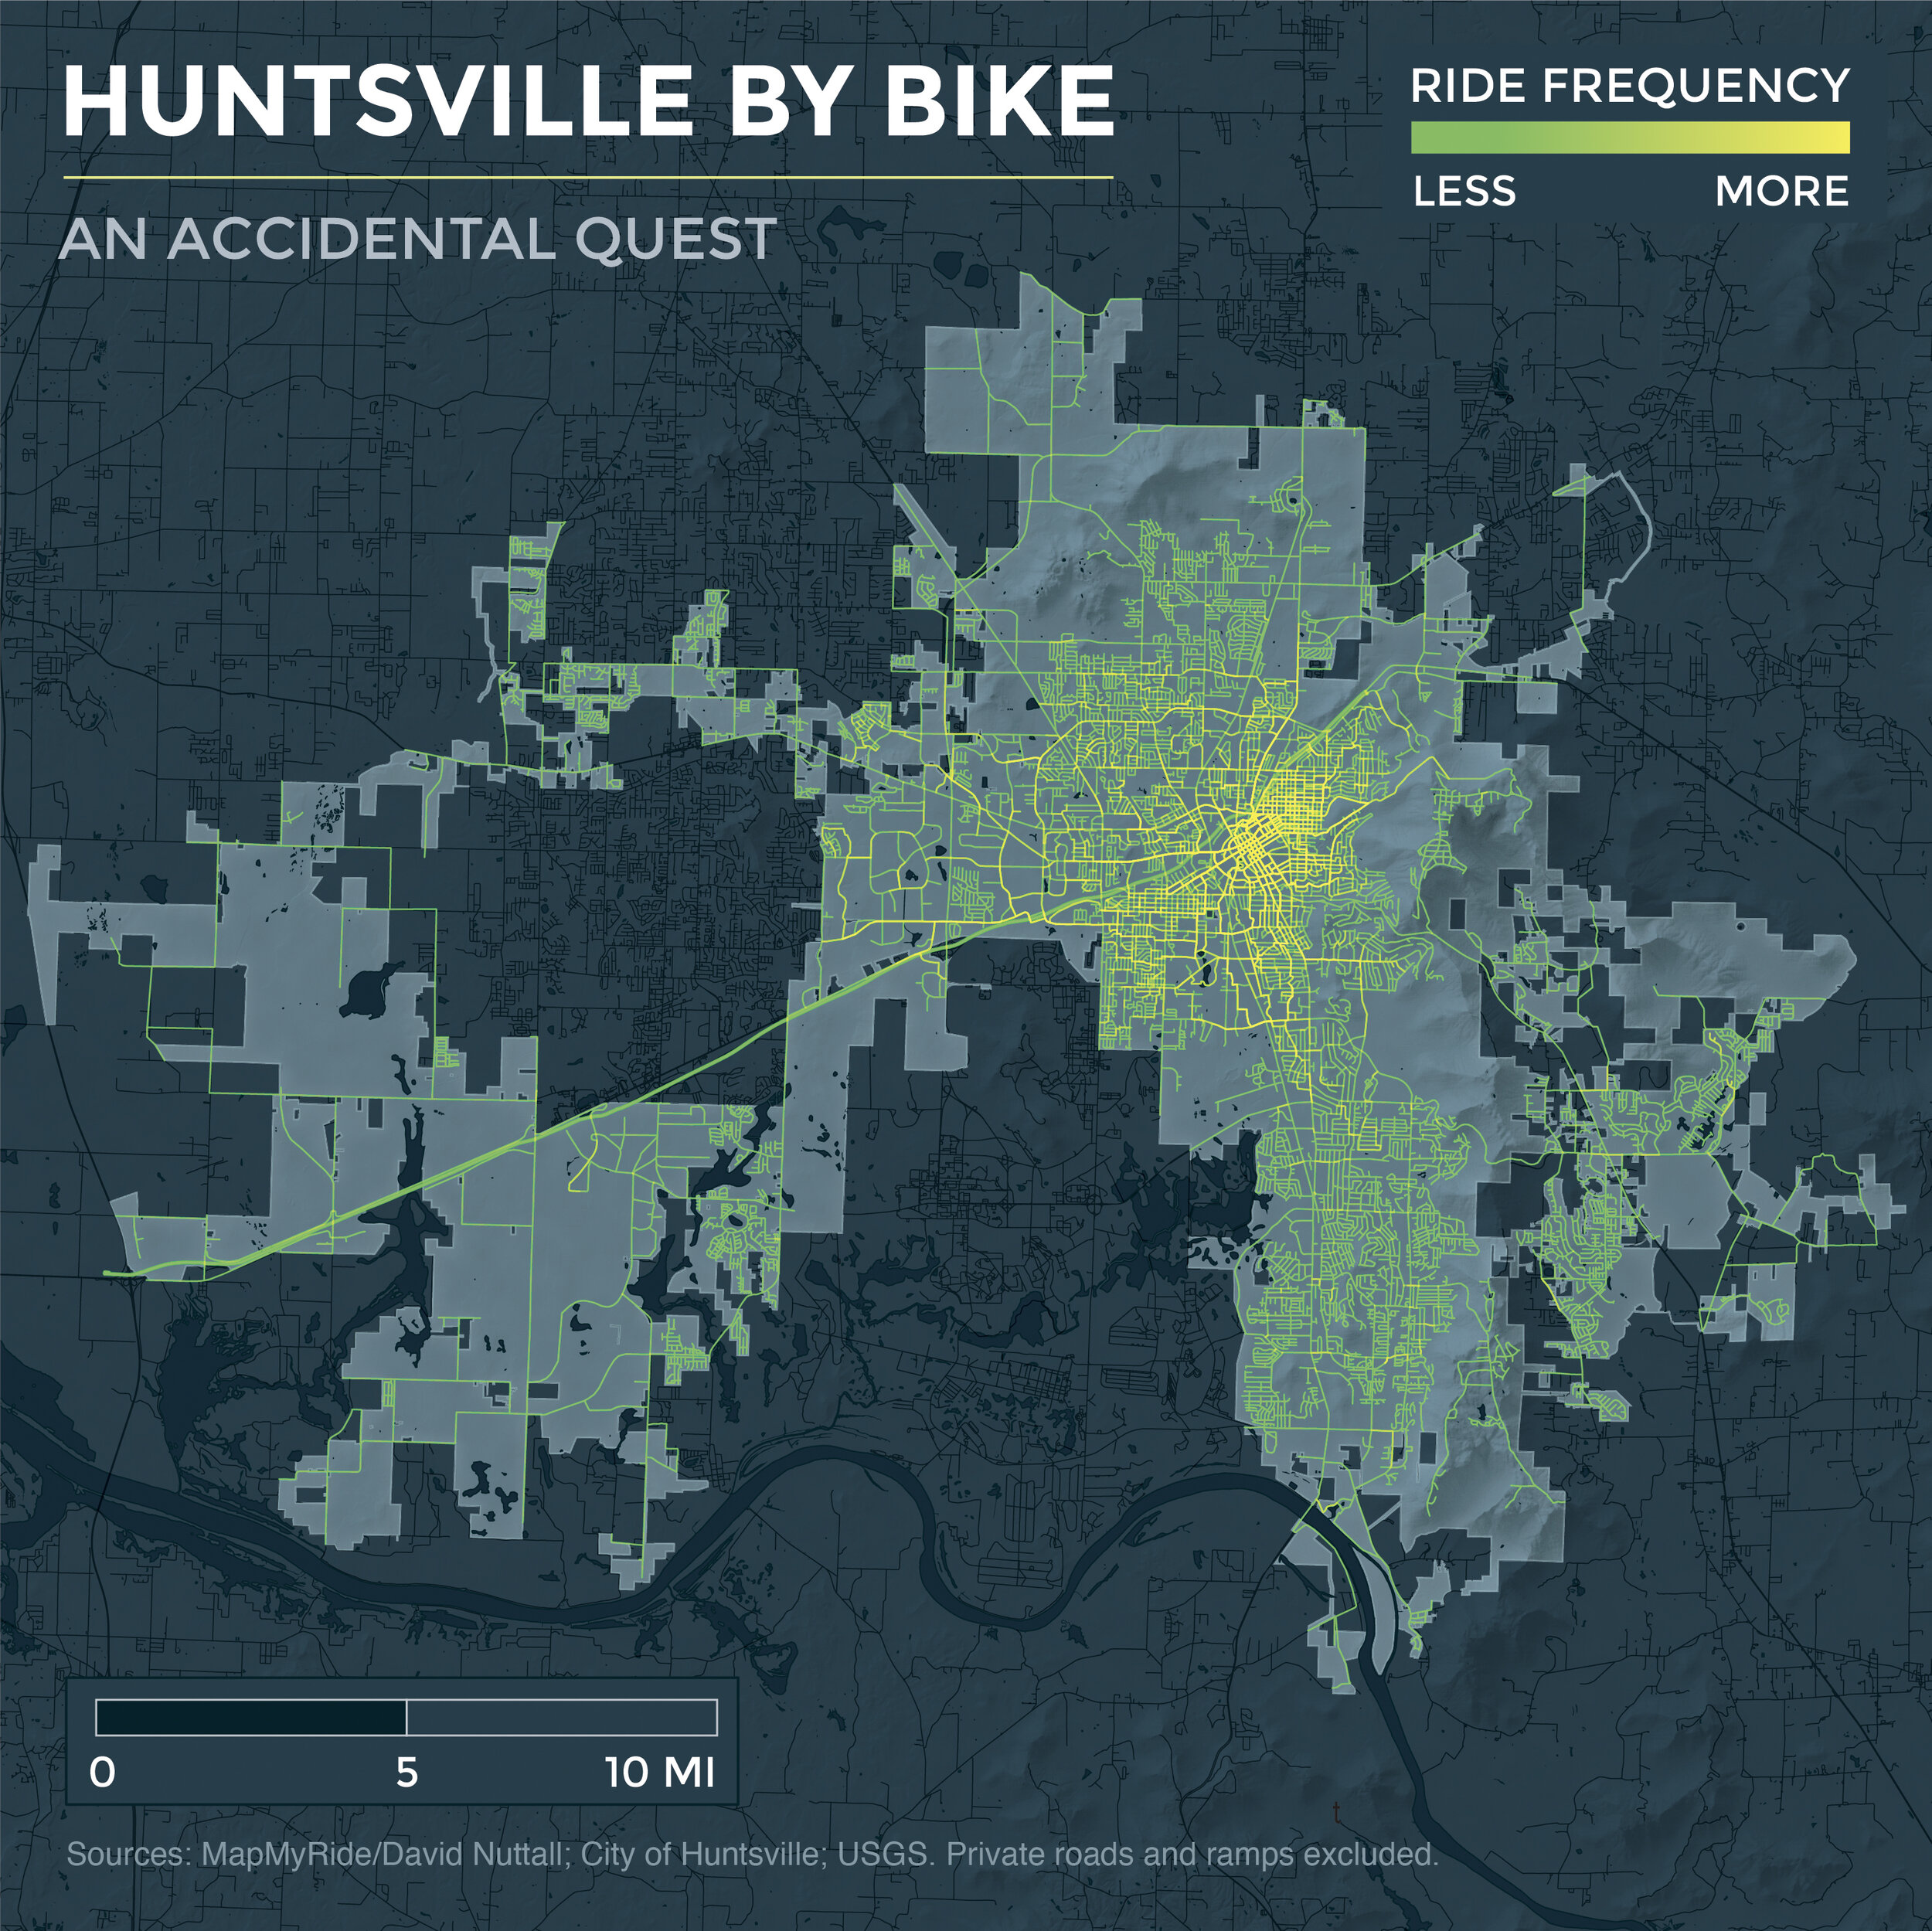
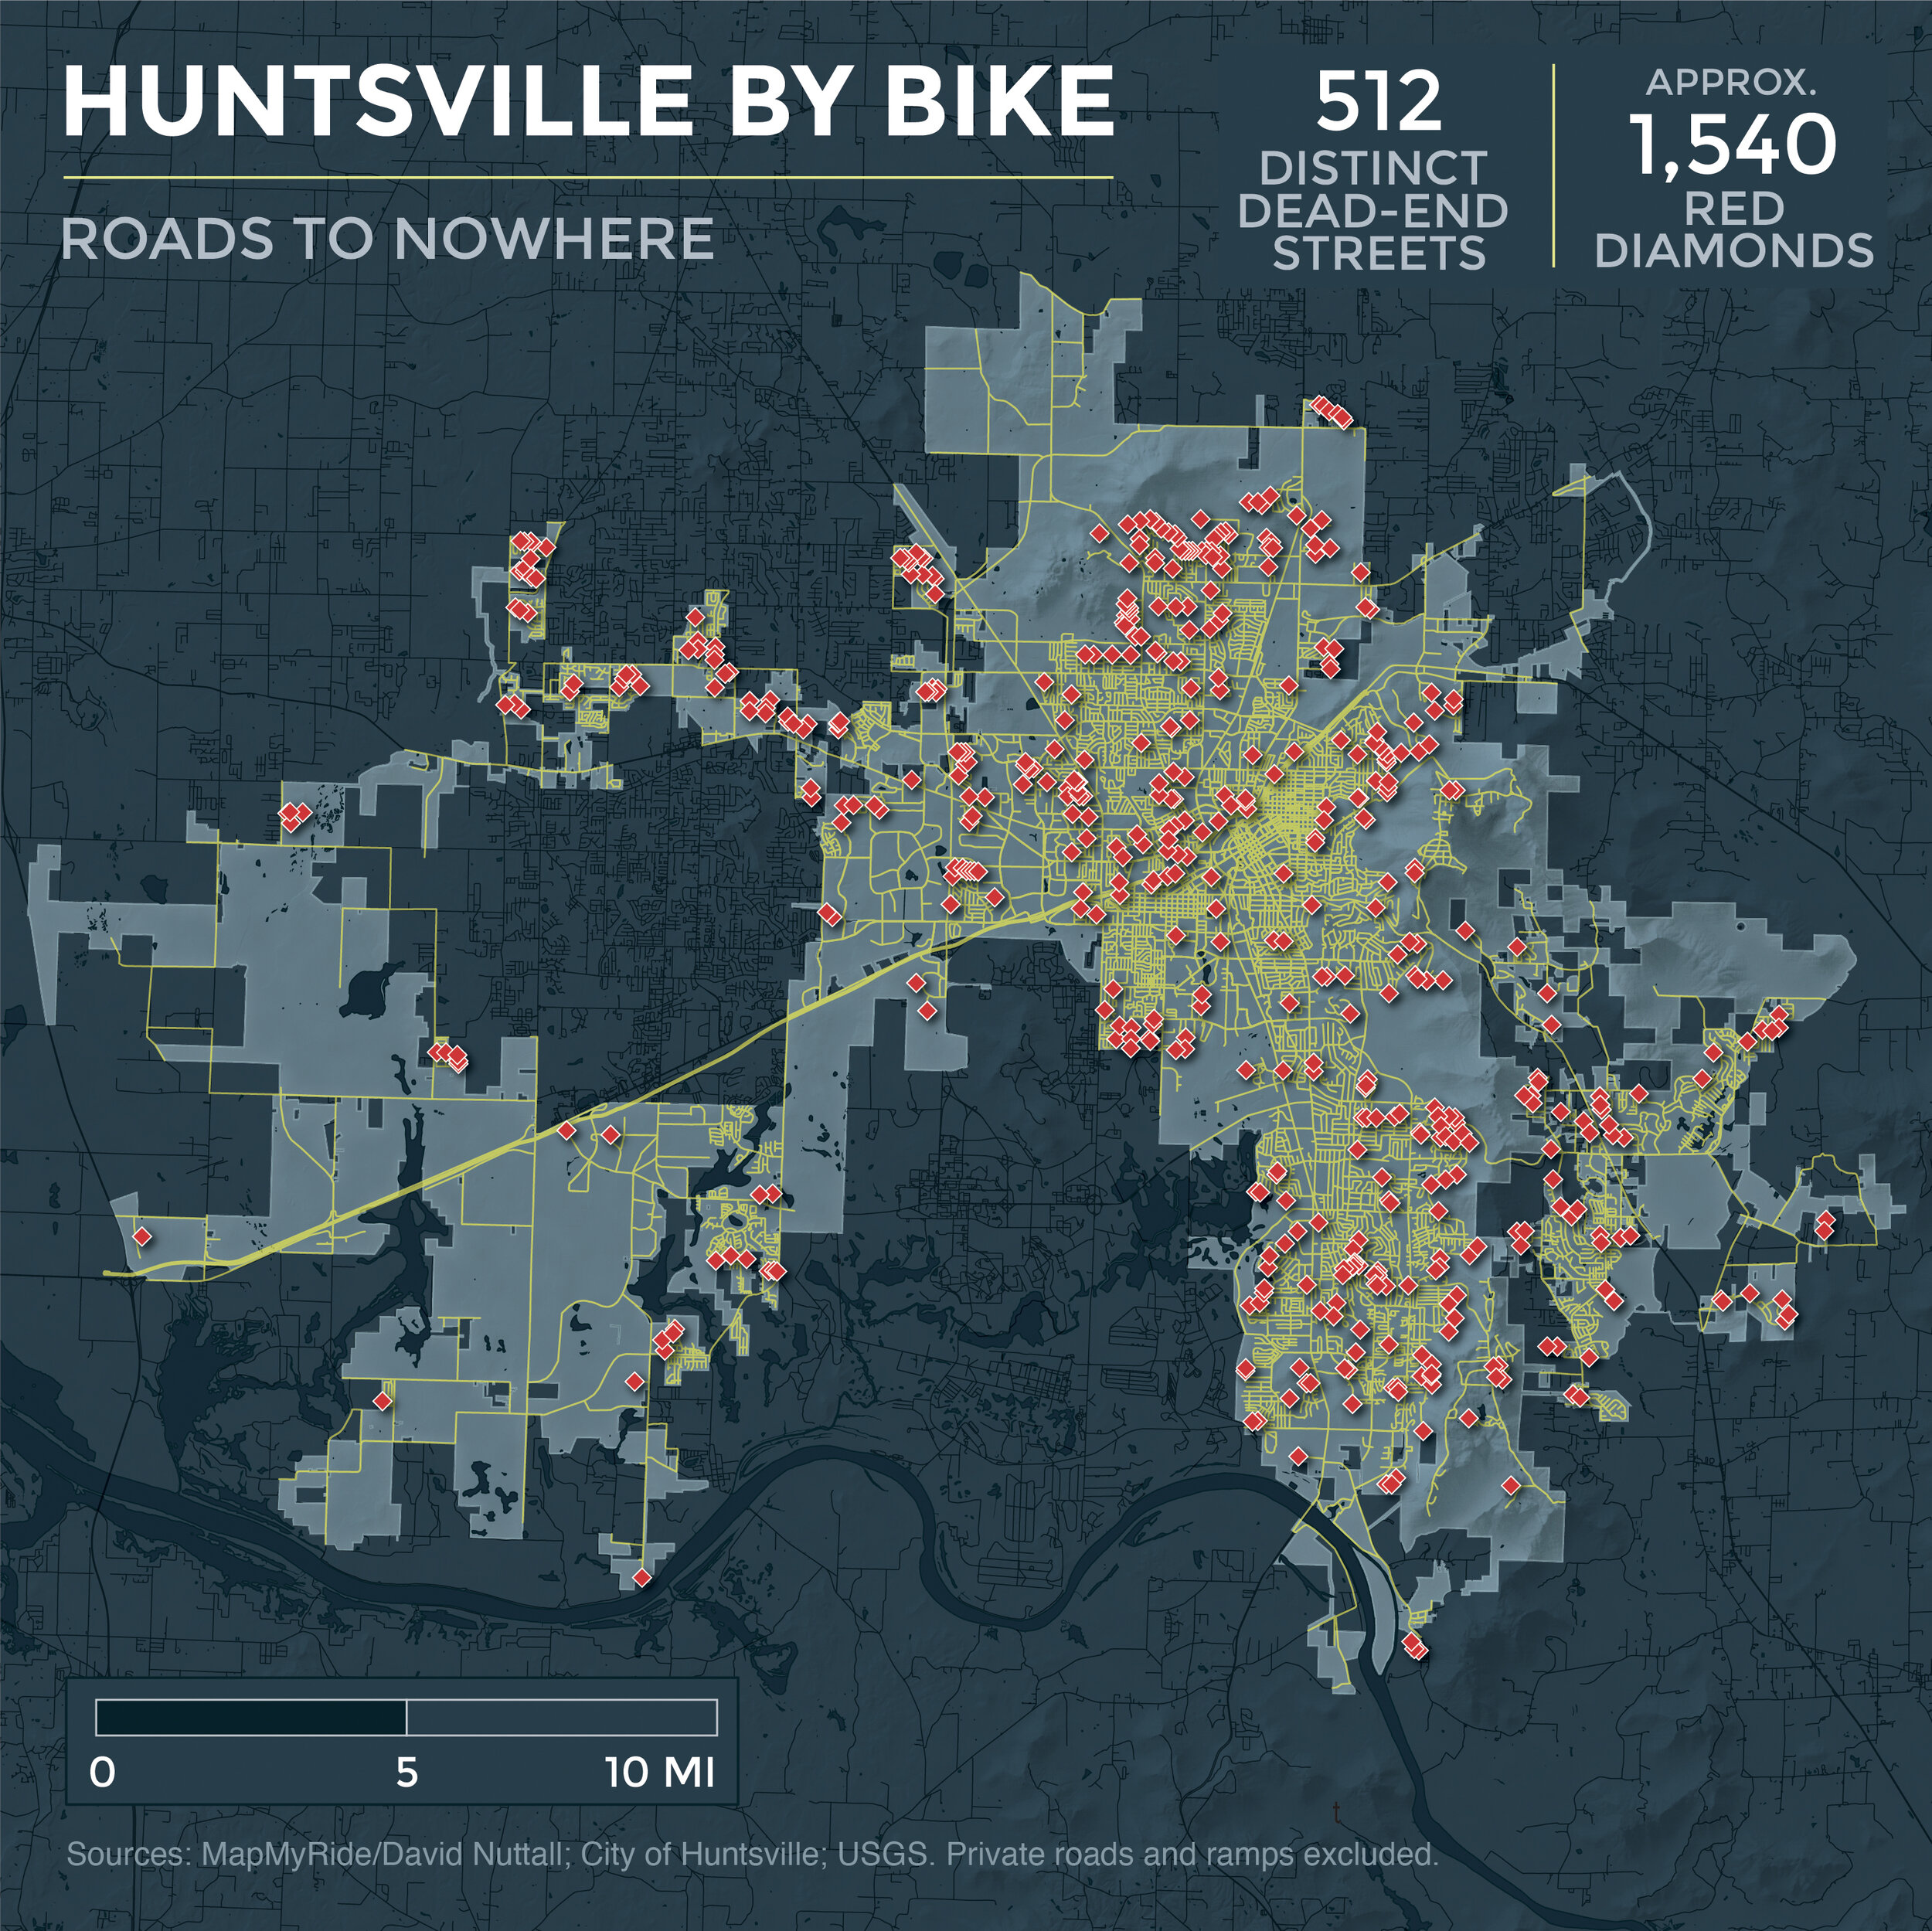
After I’d finished the animated map, I decided to do three more to support the video post and/or tell stories the animation couldn’t. While the static route map and the density map convey a deeper dive into David’s journey, the red diamond map highlights a curious feature of the city: hundreds of dead-ends marked with 2-5 red diamond-shaped signs, with 3 being the average. Huntsville is one of the fastest-growing cities in Alabama, but in many cases, neighborhoods aren’t planned with connectivity in mind.


